1. Participation in Sport and Physical Activities
To understand the level of participation in sport and physical activities by adult, the Sasakawa Sports Foundation (SSF) has examined the statistical data gathered through the “SSF National Sports-Life Survey”, which has been conducted every other year since 1992. The survey aims to understand the current situations of sport participation in terms of frequency, duration and intensity among Japanese adults, including those who participate in higher levels of sport and physical activities.
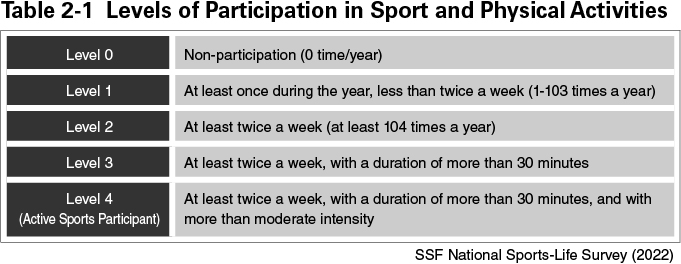
In this survey, the participation of adults in sport and physical activities were divided into the following levels; “Level 0” for those who did not participate in any sport or physical activities for the past year; “Level 1” for those who participated at least once during the year, but less than twice a week; “Level 2” for those who participated at least twice a week; “Level 3” for those who participated at least twice a week with a duration of “more than 30 minutes”; and “Level 4” for those who participated at least twice a week, with a duration of “more than 30 minutes” and with more than moderate intensity (Table 2-1).
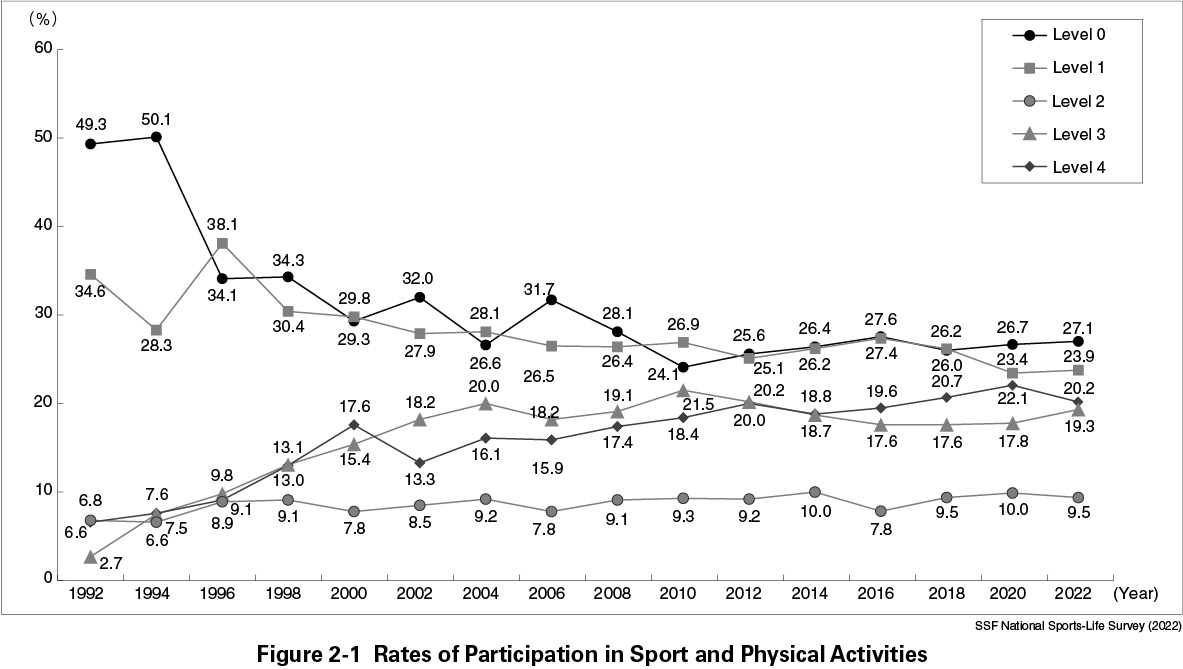
The levels of participation in sport and physical activities by adult are shown in Figure 2-1. Level 4 is the participation level recommended by the American College of Sports Medicine (ACSM) and the Ministry of Health, Labor and Welfare (MHLW) in Japan. SSF defines people who are at this level as “Active Sports Participants”. Since 1992, the percentage of Level 0 has decreased significantly from 49.3% in 1992 to 24.1% in 2010 and has been on a slight upward trend since then. Level 1 shows a relatively similar trend of its percentage, increasing and decreasing from 34.6% in 1992 to 23.9% in 2022. On the other hand, the percentages of Level 3 and Level 4 are on the rise. Over the 30-year period from 1992 to 2022, Level 3 increased from 2.7% to 19.3%, and Level 4 increased from 6.6% to 20.2%, an increase of more than 10 percentage points. Level 2 increased slightly from 6.8% in 1992 to 9.5% in 2022, but the change is smaller than for the other levels.
Comparing 2018 and 2020 to confirm pre- and post-epidemic changes in the novel coronavirus (COVID-19) infections, Level 0 increased slightly by 0.7 points from 26.0% to 26.7%. Furthermore, the percentages of Levels 2 to 4 also increased, from 9.5% to 10.0% at Level 2, from 17.6% to 17.8% at Level 3 and from 20.7% to 22.1% at Level 4 respectively, but the differences were negligible. In terms of changes before and after the Tokyo 2020 hosting, which were postponed one year and held in 2021 due to the COVID-19 pandemic, Level 0 increased 0.4 percentage points from 26.7% to 27.1% between 2020 and 2022. At Levels 2 and above, Level 3 increased by 1.5 points, while Levels 2 and 4 decreased by 0.5 and 1.9 points, respectively. However, changes at both levels were slight.
These overviews show that although there have been major social changes since 2018, such as the spread of the COVID-19 infections and the Tokyo 2020 hosting, there have been few changes in the participation rate for sport and physical activities during this period. There was no significant difference in the overall sport and physical activities within the past five years.
2. Participation in Sport and Physical Activities by Gender
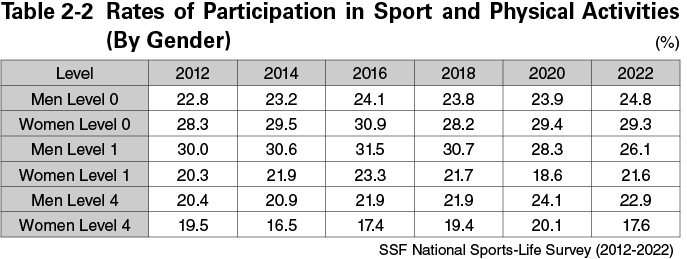
The changes in the participation rate for sport and physical activities over the last ten years (2012 to 2022) were compared by gender (Table 2-2). For men, in 2022, 24.8% were in Level 0, 26.1% in Level 1 and 22.9% in Level 4. As for changes over the past decade, Level 0 for men has increased slightly. Level 1 was around 30% until 2018, but since 2020 it has decreased to less than 30%. Furthermore, Level 4 was the highest in the last decade at 24.1% in 2020.
For women, the participation rate for sport and physical activities in 2022 was found as 29.3% for Level 0, 21.6% for Level 1 and 17.6% for Level 4. Regarding the changes in the participation rate for sport and physical activities over the past 10 years, Level 0 increased from 2012 to 2016 and decreased to 28.2% in 2018, the same level as in 2012, but has increased slightly since then. Level 1 has fluctuated, but remains at around 20%. Level 4 decreased from 2012 to 2014, then increased until 2020, and then decreased again in 2022.
Finally, a comparison of the participation level for sport and physical activities between men and women shows a higher percentage of women in Level 0 and a higher percentage of men in Levels 1 and 4. This trend has continued for the past decade.
3. Participation in Sport and Physical Activities by Types of Sport
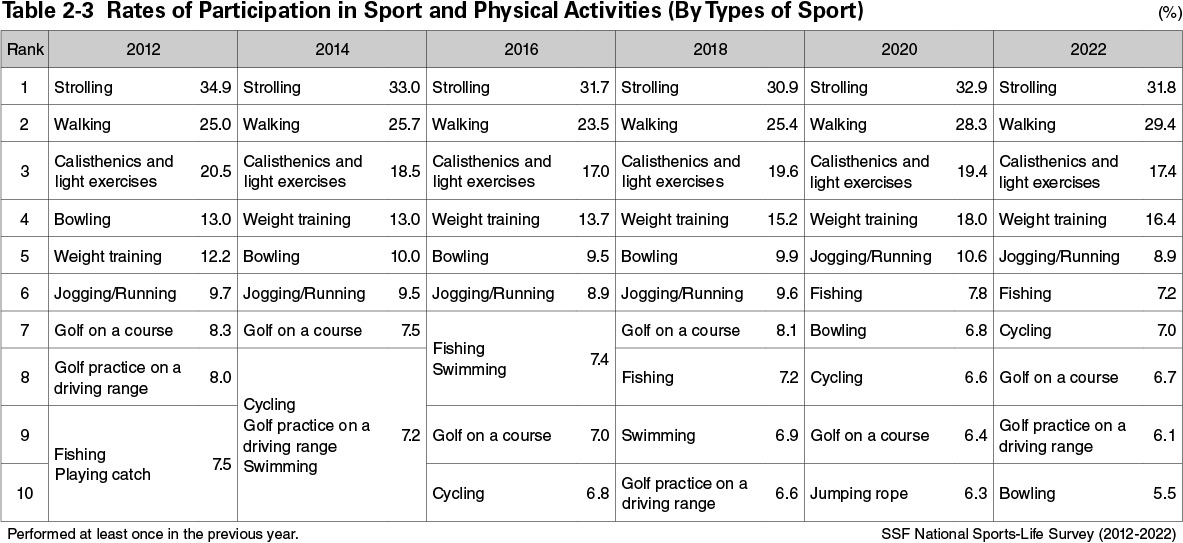
Table 2-3 shows the trends in the participation rate for various types of sport (performed at least once in the previous year). In 2022, “Strolling” was the highest at 31.8%, followed by “Walking” (29.4%), “Calisthenics and light exercises” (17.4%) and “Weight training” (16.4%). These four activities have had a high rate of participation over the past 10 years and have occupied the top activities since 2014. In addition, “Jogging/Running” has not changed much in the participation rate itself, but its ranking has been rising year by year, and the participation rate in 2022 was 8.9%, the fifth highest. The above activities can be performed by a single person and do not require special equipment or facilities, and because they can be performed casually, the participation rate is considered consistently high.
As for others, “Fishing”, “Cycling”, “Golf on a course”, “Golf practice on a driving range” and “Bowling” were highly participated in 2022. Among these, a distinctive trend in recent years has been a downward trend in the “Bowling” rate since 2012. Especially since 2018, both its participation rate and ranking have decreased, and this may be partly due to the closure of facilities by the COVID-19 pandemic. A similar trend was also seen in “Swimming”, with a participation rate of around 7% from 2014 to 2018, but since 2020 it has not entered the top ten.
4. Participation in Sport and Physical Activities during the COVID-19 Pandemic
The SSF conducted a “National Survey on The Effects of COVID-19 on Sports and Physical Activities” to examine the participation status for sport and physical activities in the COVID-19 pandemic. This survey was performed three times, every four months, in June and October 2020 and February 2021, among men and women aged 18-79 years throughout Japan, in an attempt to understand the impact of the COVID-19 pandemic on their sport and physical activities.
In terms of the participation rate for sport and physical activities by types of sport during the COVID-19 pandemic, “Walking” was 27.1% from February to May 2020, 23.1% from June to September, 25.2% from October 2020 to January 2021, and “Strolling” was 18.4%, 12.2%, 14.2% and “Weight training” was 11.4%, 9.7%, 10.0%, during the same periods (Table 2-4). The top-ranked activities that can be performed relatively casually at home or around home were most frequently conducted from February to May during the year. On the other hand, the rates of other activities using sport clubs and facilities such as “Golf on a course” (3.0%, 3.5%, 3.6%), “Golf practice on a driving range” (2.7%, 3.2%, 3.4%), “Swimming” (1.5%, 2.2%, 1.7%) were the lowest from February to May 2020, then showing a slight increase to flat trend after June 2020. The closure and subsequent reopening of sport clubs and facilities due to the state of emergency declaration issued in April 2020 is thought to have affected the participation rate for sport and physical activities.
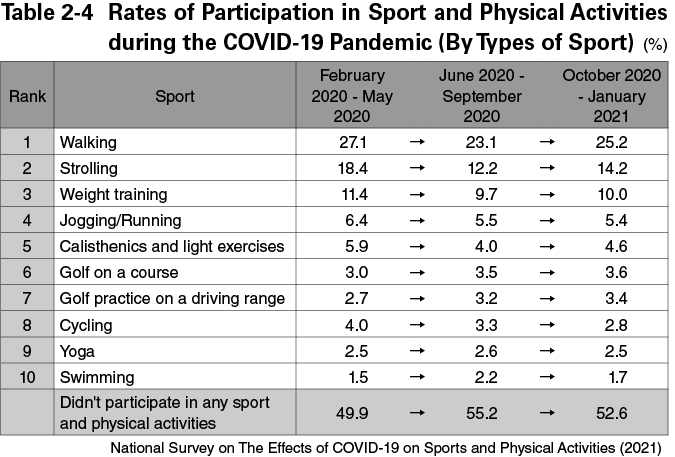
The one-year trend in the percentage of people who did not participate in any sport and physical activities was 49.9% from February to May 2020, 55.2% from June to September 2020 and 52.6% from October 2020 to January 2021, with the lowest percentage in February to May 2020. In the one year since the first infection with the COVID-19 in Japan, it can be said that the largest number of people conducted sport or physical activities from February to May 2020, which includes the period of the first declaration of the state of emergency.
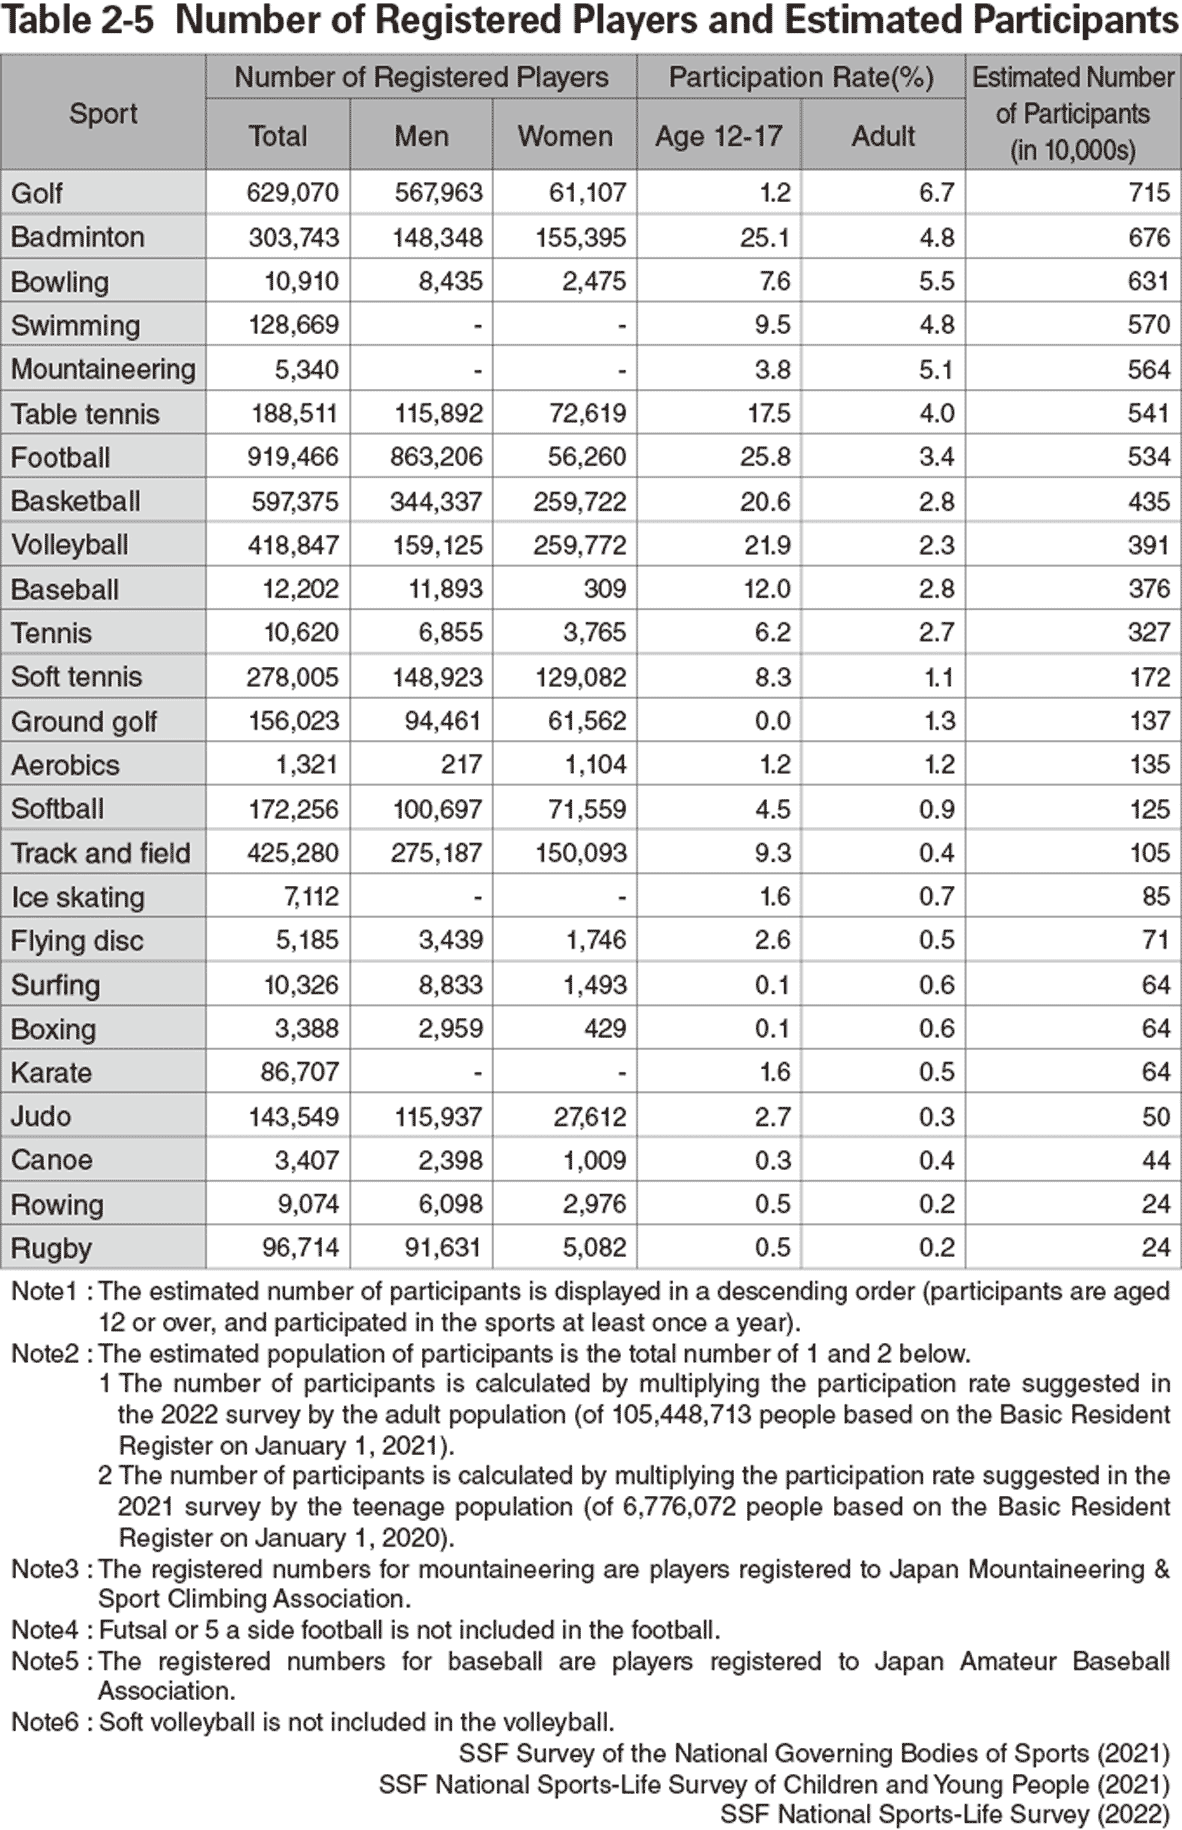
5. Number of Registered Players by Types of Sport
In order to participate in competitions hosted by National Governing Bodies (NGB) of sport or their affiliated organizations, participants are required to pay an annual membership fee. These participants are acknowledged as registered players.
The number of registered players that were released by NGBs and the estimated number of participants in top sports that were performed by the participants at least once a year according to the results obtained from “The 2022 SSF National Sports-Life Survey” and “The 2021 SSF National Sports-Life Survey of Children and Young People”, were listed in Table 2-5.
When the number of individual players was examined, the sport that had the largest number of registered players was “Football” with 919,466 people, followed by “Golf” (629,070), “Basketball” (597,375), “Track and field” (425,280), “Volleyball” (418,847), “Badminton (303,743)” and “Soft tennis” (278,005). By gender, the number of men registered was higher than that of women in many sports, with the exception of “Volleyball”, “Badminton” and “Aerobics” that had a higher number of women.